


Oh, Wait, Maybe They Don’t Want You Dead!
The CDC is fudging the all-cause mortality data

Really, they don’t want me dead?
Just kidding, of course they do. But they don’t want your loved ones to blame your death on the vaccine, their horrible hospital protocols, or their withholding of effective early treatments. Accordingly, it appears the CDC has been fudging their 2021 mortality data. I’ll pretend I’m shocked.
Honestly, I am, a bit. My shock threshold has risen way up over the last two years, but this one took me by surprise. I just had a conversation the other day with my science-nerd daughter about how the one statistic they really can’t fool around with is the total deaths number, because it’s compiled from county-level offices and has to match up at least somewhat with other sources. But alas, nothing is sacred, and no one is accountable in our federal government any longer.
For those who don’t remember, three months ago, I wrote a post entitled, They Want You Dead: All-Cause Mortality Up 51% in 25-54 yr olds for Q3 2021, where I compared the excess mortality in the third quarters of 2020 and 2021. Excess mortality was defined as the difference between those years’ deaths and the average of 2015-2019. You can return to that post here, if you’d like to refresh yourself:

My plan was to return to this topic, now, three months later, and do the same for Q4. I was pretty excited to run this next chapter, because I wanted to see how many more people our esteemed leaders had killed with their poor treatment protocols, booster shots, and teenager shots over the holiday season. But a funny thing happened when I downloaded the refreshed dataset…

Typically, the numbers in the CDC all-cause mortality data will change over time, because corrections happen, and late reports flow in, even months later. That’s why I waited, both with my original piece and with this one, until 5 or 6 weeks into the new quarter before downloading the data. Just to be sure of my numbers, though, I always keep the originals as they were, start a whole new spreadsheet for the update, and check for differences. As I said, you expect some change—usually way less than 1%—but it’s almost always an upward correction. It’s not often you find folks who were marked as deceased, magically come back to life. The corrections usually go the other way; the death counts go up.
But not this time.
You see, between my original download in mid-November 2021 and my new one in mid-February of supposedly the same data, the count of Americans who died from all causes during the first three quarters of 2021 fell by over 220K. That’s right, we’ve got some serious zombie action going on at the CDC—almost a quarter million newly “undead” Americans.

So let’s break this down. In my summary table below, going across, you’ll find the original data from November, then the February update, then the difference. As you can see, the older data, the 2015-2019 average (1st set of rows), is virtually unchanged, which you would expect after two years. The 2020 data (middle rows) has some adjustments, which isn’t crazy, because it’s still somewhat fresh, and lots of local government offices were closed for a good portion of 2020 and 2021, but as you’ll notice, the 2020 adjustments are almost all increases, that is, new deaths that weren’t reported earlier, a few hundred on top of 3.4 million (+0.02%).
What I’ve never seen before is what’s going on with the 2021 data (bottom set of rows)--basically, a 9% downward correction in deaths. To put this in highly sophisticated mathematics language, “Say what?” There’s no logical explanation for that kind of correction in CDC mortality stats, and none of their technical notes begin to address this.
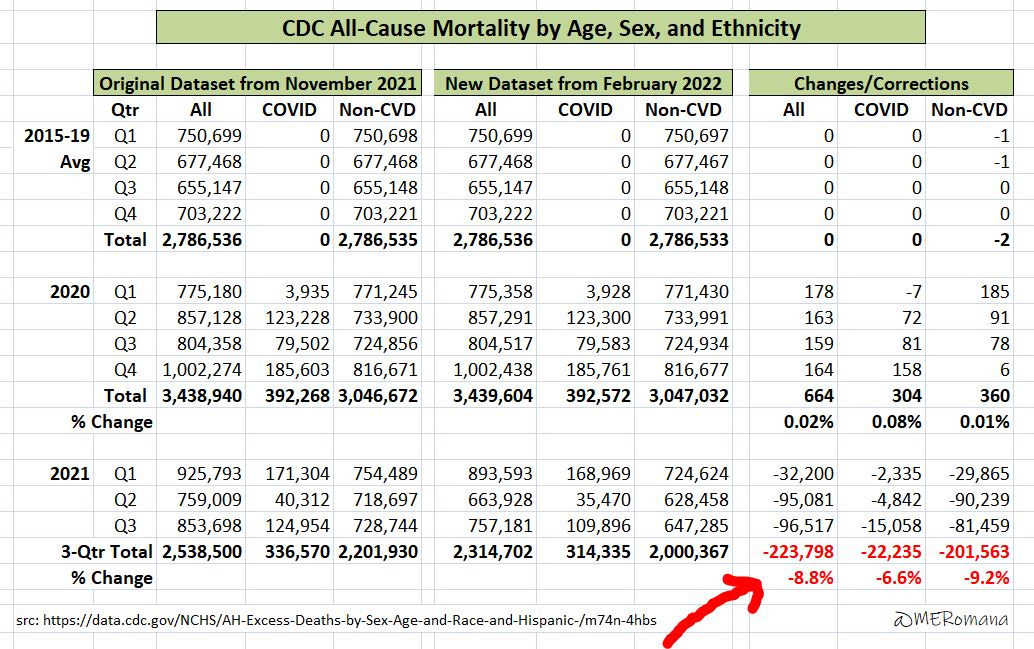
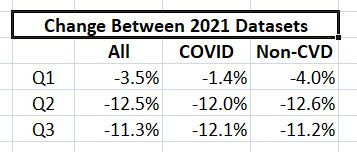
What’s even more interesting is that the majority of the “correction” is stuffed into the second and third quarters, and very little in the first. It’s almost like the fudgery is purposely paired with the time period when the majority of the young and healthy people in this country were being vaccinated and boosted, and lots of people, vaxxed or not, were experiencing the Delta variant without the benefit of early treatment. You know, almost like someone wants to make it look like a bunch of people didn’t die, when they did.
I further explored whether these variances were clustered by gender, age, or racial group, as that might’ve pointed to some honest error in data collection. But no, the changes were rather neatly distributed across those categories, almost like something that could’ve been done algorithmically…not that I’m implying any data hanky-panky here.
So help me out, folks. Has anyone heard of any big all-cause mortality correction move by the CDC lately? Am I missing something everybody else knows? Is it really Night of the Living Dead this time? Or are they actually fooling around with the one statistic I always thought couldn’t be monkeyed with?
I do plan to go ahead and create an update to the earlier article with the Q4 numbers, but I won’t feel good about it. This data looks like garbage!
Thank you, Maria. I will take a look at this more closely as soon as I can. But as you may know, I already published a piece on the all-cause data, in which I suggested that the CDC could in fact be fudging those numbers. Specifically, I think it is possible the 2020 data were inflated. So, I would not be at all surprised to hear that they've done it again. And yes, I could see them using an algorithm to make the adjustments. They are absolutely that corrupt.
For data in general it looks like the powers that be have moved from ignoring the data to "misinterpreting" the data to falsifying the data.
State and local data is harder to falsify at least for now.