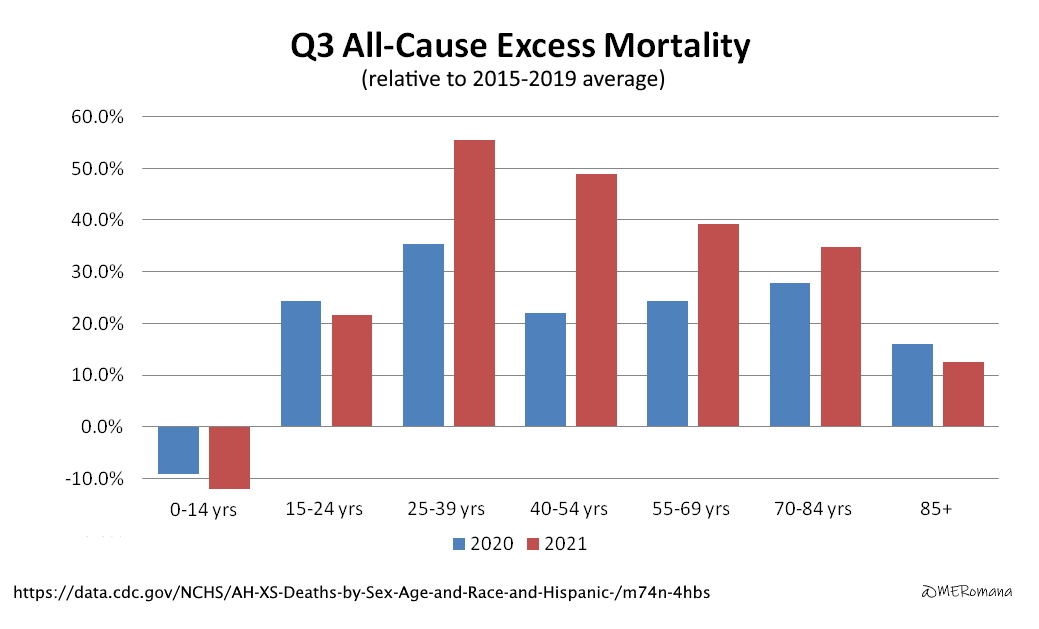
Let me start off with a hat tip to “Political Statistics”, whose Substack article about the US CDC All-Cause Mortality dataset inspired me to do some digging and analyzing of my own. You can read his article from October 27th here.
I downloaded the dataset and spent several days working with it. When I was done summarizing, cross-tabbing, and of course, graphing, I had numbers more startling than I’d imagined. Indeed, as suggested in the title, I found that mortality for the third quarter of 2021 was 51% higher for 25-54 year olds than for the same period in 2015-2019 (the pre-COVID era). The same number for all age groups combined is 30%. THIRTY PERCENT! Almost one third more people died in America last summer than is normal for our country. Let that sink in.
Details of how I got to this are further down, but for you TLDR types, here’s the short version:
See those long red lines? They represent the percentage of deaths in excess of the 2015-2019 average. For example, death rates for 40-54 year olds in 2021 were 49% higher, and for 25-39 year olds, it’s a full 54% higher. In short, whatever we’re doing to “save Grandma” is killing Mom and Dad instead.
Further, see how much longer most of the red lines are than the blue? For every age group from 25 to 84, more people died in Q3 2021 than in Q3 2020. That is, with more than half the population “fully vaccinated”, there were far more excess deaths this past summer than the summer before, when a so-called novel virus was on the loose, and mass rioting and violence defined “The Summer of Love”.
The only age groups whose Q3 mortality improved from 2020 to 2021 were those at the far ends of the spectrum. Fewer in the 85+ group passed away in Q3 2021, and I’m sure the FDA/CDC will insist that was due to their high vaccination rate, however, one could equally argue a dry tinder effect, given the excessive mortality for this group over the prior winter.
At the other end, the 15-24 year old group saw a slight improvement in death rates, but their vaccine uptake was low, and their return to normal life was high. The 0-14 year olds were the only age group with reduced mortality for all of 2020, and an even greater reduction in 2021. For the umpteenth time, kiddos don’t die of COVID, and I shouldn’t have to point out that they were almost entirely unvaccinated during Q3. Let’s check back on their status in January.
Now, we can’t use this data to blame an incredibly dismal picture of American mortality on the vaccines, because it’s purely correlative data with lots of possible explanations. One thing we can say, however, is that the vaccine roll-out certainly didn’t save lives overall. Again, our Q3 2021 all-cause mortality was 30% higher than the average for this period in 2015-2019, while in 2020, that number was only 23%.
If the CDC hadn’t gone out of their way to muddy up the stats regarding this disease and these vaccines, we might be able to draw some better conclusions, but instead, most COVID-related data is purposeful garbage, because they don’t want answers. They don’t want answers, and they really don’t want questions, like the kind you might ask after seeing this.
Finally, for those of you who actually care how I got to the headline graph above, here is the process.
The dataset is available at https://data.cdc.gov/NCHS/AH-XS-Deaths-by-Sex-Age-and-Race-and-Hispanic-/m74n-4hbs. It contains weekly mortality by sex, age, and race (plus Hispanic/non-Hispanic) for years 2015-2021. I used the average of 2015-2019 as a baseline non-COVID mortality period for comparison to 2020 and 2021.
Since I wanted to do a comparison of three periods: pre-COVID, COVID, and vax-COVID, I needed something besides pure calendar years. Mortality in the US didn’t really start to change until right around the start of the second quarter of 2020, so we can’t use the first quarter, and because the vaccines weren’t widely disseminated until late spring/early summer of 2021, I tossed the second quarter, as well. And since Q4 2021 isn’t over yet, I’m left with only the third quarter as a valid comparison period for what appears to be a highly seasonal virus.
By July 1st, 2021, about 52% of the population was double-jabbed, and 70% was single-jabbed, and those percentages continued to slowly rise during the third quarter. Most of the early vaccinees (the elderly, healthcare workers, etc.) should have still had some efficacy left to their vaccine last summer, since they were mostly vaxxed during February and March. The twenty-somethings through fifty-somethings took most of their vaxxes in April, May, and June, so they all should have been “super immune” for the summer, right?
And yet, this happened. In the stats world, and the real, non-fantasy world of our gov’t and mass media, we would ask, “What changed?”
Was it the Delta variant? Was it a treatment change (specifically, a disinformation campaign against proven treatments like Ivermectin & Hydroxychloroquine, and collusion among big healthcare systems to disallow their use)? Or was it mass inoculation with an experimental drug technology?
I welcome your thoughts. Please discuss!


The 0-14 year old age group normally are injected with a truckload of various vaccines, because they are safe and effective, of course. During the 2020-2021 time frame, due to lockdowns and restricted access to "normal" medical procedures, many of the 0-14 year olds didn't get those life saving vaccines. Yet, they had an improved rate of all cause mortality. Interesting.
Nice work. Hospital doctors were cutting patients' throats in Spring, 2020 - often killing them because mechanical ventilation was later shown to be overused. I wouldn't be surprised if medical decisions were even worse in 2021 as the COVID panic metastasized.
I had also looked at CDC all-cause deaths, and found a concerning lack of COVID seasonality for under-45s. https://norstadt.substack.com/p/are-the-usa-sacrificing-the-young